This page is part of the homeplace advertisement-free web portal.
The value of the “Greenspan spread” is normally near zero -- about 6 basis points (0.06%). In July 2007 it shot up. It went to a new high of 106 (1.06 %) in Dec 2007. After Lehman filed for bankruptcy in Oct 2008, the measure soared briefly to 364 (3.64 %)!
BIG is BAD! Greenspan said in June 2008 that when “Greenspan spread” gets down below 25 basis points (¼ %) the banking crisis will be over.
This October 28, 2011 discussion is from here .
A key indicator of banks' wariness to lend this week hit its worst level since July 2009 according to Bloomberg data.
The spread between 3-month Dollar Libor (the rate at which banks lend Dollars to other banks for three months) and the overnight indexed swap rate (a lower fixed rate as interest rate swaps are considered less risky than cash lending), the Libor-OIS spread, is viewed as a measure of money market stress, tending to rise when banks perceive the risk of lending to each other is greater.
This 2-page St Louis Fed article is a good introduction.
As an aid to visualizing the Greenspan spread, consider the following.
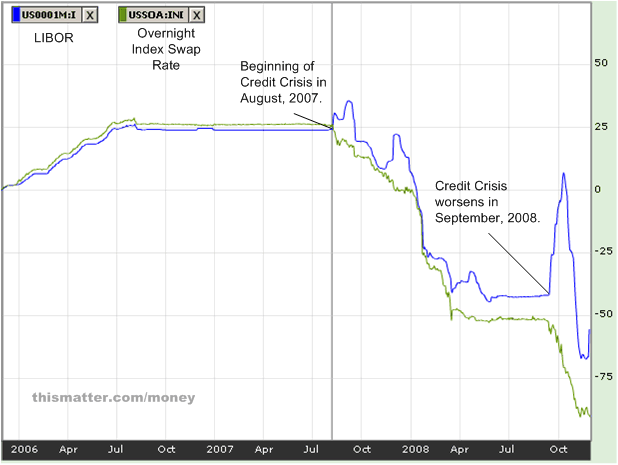
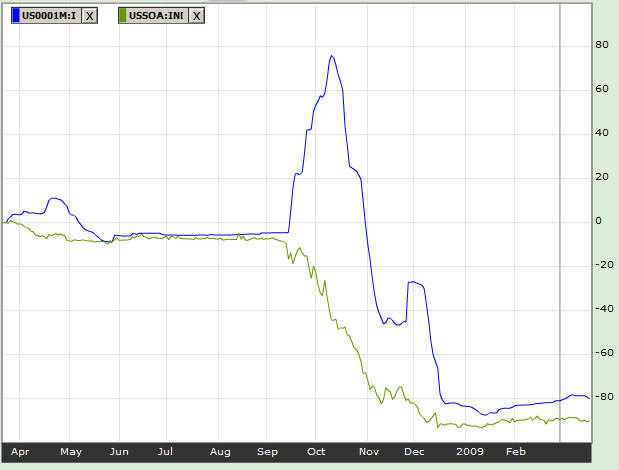
The 1-month version of the 'Greenspan' spread, LIBOR minus OIS , has averaged 6 basis points from January, 2006 to August 1, 2007. During the Credit Crisis of 2007 and 2008, the maximum spread was over 100 basis points. (Source here.) Note that this is a one month version, while we select the three month version as the “Greenspan spread”.
Here is what should be an accurate reportage of the true (3-month) Greenspan spread. The time interval is late February to late August 2008.
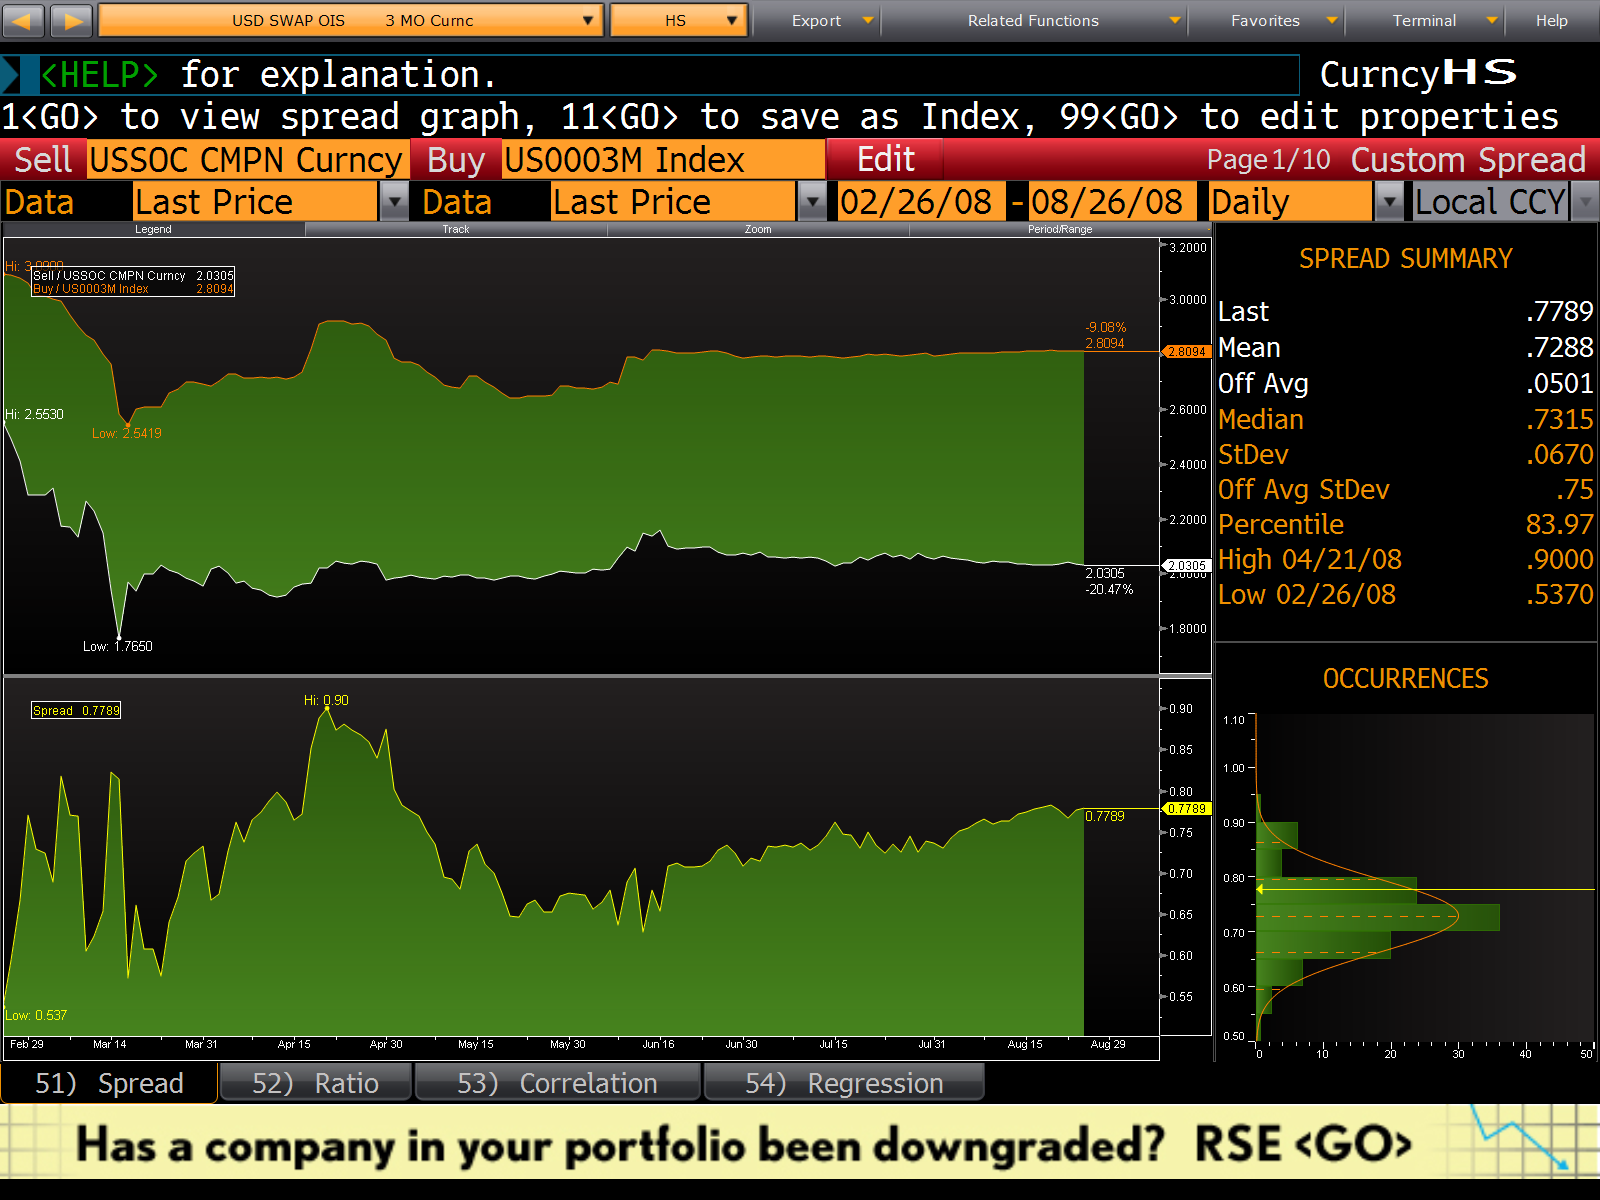
The spread Greenspan says he focuses on as a measure of the willingness among banks to lend is the spread, or difference , between
the BBA LIBOR USD 3 Month value and
the USD overnight index swap, or OIS, rate forward 3 months.
We will call this spread the Greenspan spread. (Calling it LIBOR-OIS has a little too much potential for confusion, here.)
The minuend is collateralized only by the good faith and credit of the borrowing bank.
The subtrahend is less risky for the lender, being collateralized by a major currency -- euros, say.
These two rates vary similarly (between well under 1% per year to well over 5% per year) over time. So the difference of the two, Greenspan's spread , is very sensitive/volatile and quivers exquisistely as it indicates banking health.
On Feb 23, 2009 Greenspan said "Libor-OIS remains a barometer of fears of bank insolvency." "That fear has been substantially reduced since mid-October, but the decline has stalled well short of any semblance of normal markets."
The Greenspan spread belongs to a class of risk measures where the basic measure is a “BOR” (a bank offering interest rate). Some of these measures, such as the Greenspan spread and the TED spread, have been refined by subtracting another presumably-safer and presumably-similarly-varying rate. These differences, or spreads, are a sensitive measure of the lender's perception of the riskiness of the class of entities eligible for the loan.
The following table shows what the Greenspan spread might be. (There's a little confusion in the Media.) I think it's actually the last row.
|
Difference |
Minuend |
Subtrahend |
|
Greenspan spread |
London interbank dollar offered rate, or LIBOR, forward 3 months |
Overnight index swap rate (OIS) traded forward 3 months |
|
(a measure of the willingness among banks to lend) |
(the rate banks charge for 3-month unsecured dollar loans) |
(a short-term interest rate swap where one side pays an overnight rate, compounded over the tenor of the swap while the other side pays a fixed rate. The Fed Effective Rate is the benchmark for OIS and is a domestic overnight rate. This rate also exists in the future, say 3 months, or a year forward.) |
|
Probably not this: |
“BBA LIBOR USD Overnight ” (US00O/N:IND ) (probably no) |
|
|
Probably not this: |
“BBA LIBOR USD 1 Month ” (US0001M:IND ) (probably no) |
“USD SWAP OIS 1 MO ” (USSOA:IND) (probably no) |
|
The Speculated Greenspan spread. I think the [preferred version of the] spread [ (which we call the Greenspan spread) ] is this. But Bloomberg has, through most of 2008 and as recently as here and here and here and here and in this May 2009 article referenced the minuend or the subtrahend only, rather than the difference!!) -FNC |
A basis point is 0.01 of a percentage point. That is, a basis point is a ten-thousandth.
“The worst is over in the financial crisis or will be very soon,” he says. In addition, “There is a reduced possibility of a large, intense recession.”
As discussed in a recent
Bloomberg article,
the spread between the 3-month
Libor and the overnight
index swap [OIS] rate, traded
forward 3
months, is greater
than similar expiring spreads. This recent movement in the spread is
signaling that traders are concerned that banks will have
difficulties obtaining cash to fund existing assets, as well as
putting into question their ability to shore-up their balance sheets.
In general, an increasing spread signals that funds are becoming less
available. The recent activity appears to be driven more by traders
leaving the short-term, closer to expire positions early over worries
about Libor and its reliability.
|
LIBOR-OIS (Greenspan) spread, in basis points |
When and Reported by Whom |
|
|
|
|
11 (0.11%) |
199806 to 200806 “The spread averaged 11 basis points for the 10 years prior to August [2008], when the global credit crunch began.” http://www.bloomberg.com/apps/news?pid=newsarchive&sid=aH_TsBEHBRqI |
|
19 |
200306 to 200806 “It averaged about 19 basis points over the past five years. ” http://www.bloomberg.com/apps/news?pid=newsarchive&sid=amtoaXN6ltzY 20080613. |
|
6 |
20050000 Average for 2005-2006 |
|
52 |
20070731 Average 20070731-20071231 |
|
25 |
20070808 (“when the credit crisis began in earnest”) |
|
110 |
20071100 (guessing the date) peak for CY 2007 |
|
106 |
20071200 Maximum during Dec 2007 |
|
66 |
20071231 http://www.bloomberg.com/apps/news?pid=newsarchive&sid=aCgIw40SBXAA |
|
90 |
20080101 Maximum Jan 1 2008 to July 5 2008 |
|
24 |
20080101 Minimum Jan 1 2008 to July 5 2008 |
|
12 |
20080116 |
|
73 (0.73%) |
20080331 http://www.bloomberg.com/apps/news?pid=newsarchive&sid=aH_TsBEHBRqI |
|
67 |
20080609 http://www.bloomberg.com/apps/news?pid=newsarchive&sid=aH_TsBEHBRqI |
|
69 |
20080613 http://www.bloomberg.com/apps/news?pid=newsarchive&sid=amtoaXN6ltzY |
|
73 (0.73%) |
20080625 http://www.bloomberg.com/apps/news?pid=newsarchive&sid=ajTzXTgDbLHU |
|
72 |
20080702 http://www.bloomberg.com/apps/news?pid=newsarchive&sid=aCgIw40SBXAA |
|
11 |
1997 Average over the last 10 years up through 200707, when the global credit crunch began. http://www.bloomberg.com/apps/news?pid=newsarchive&sid=aCgIw40SBXAA |
|
0.78 percentage point |
20080708 http://www.bloomberg.com/apps/news?pid=20601087&sid=aHAKeCfmeo44&refer=home |
|
78 |
20080825 http://bloomberg.com/apps/news?pid=20601087&sid=a9RBw7GoIjnA&refer=home |
|
340 |
20081016 http://www.bloomberg.com/apps/news?pid=20601087&sid=aOKgTSW6_nXI |
|
1.25 percent |
20090223 http://www.bloomberg.com/apps/news?pid=newsarchive&sid=avRdLtxSSUwk |
|
55 basis points (0.55%) |
20090521 “The Libor-OIS spread, a gauge of banks’ reluctance to lend, narrowed to 55 basis points, the least since February 2008. It was as high as 364 basis points in October. That’s an “extraordinary improvement,” said Greenspan, who last year said that the credit crisis would be at an end once the Libor-OIS spread narrowed past 25 basis points. ” |
|
Around 12 basis points |
20110801 http://goldnews.bullionvault.com/gold_prices_102820111 |
|
34.5 basis points (0.345 percentage points) |
20111027 http://goldnews.bullionvault.com/gold_prices_102820111 |
|
.342 (34.2 basis points) |
20111028 morning http://www.bloomberg.com/apps/quote?ticker=.LIBOROIS:IND |
http://www.bloomberg.com/apps/news?pid=newsarchive&sid=aCgIw40SBXAA
The price on one-year cross-currency basis swaps between euros and dollars reached minus 34.8 basis points today, the largest effective premium for dollar borrowing in swaps since the introduction of the euro in 1999, according to data complied by Bloomberg. The price averaged close to zero between 1999 and the start of the subprime mortgage market collapse in August. A negative price indicates investors are willing to receive reduced interest payments on euros they lend in order to obtain financing in dollars.
A Black Swan In The Money Market
John B. Taylor and John C. Williams (not Walter J. "John" Williams)
"The authors find no statistical relationship between the LIBOR-OIS interest rate spread and the utilization of the Term Auction Facility."
Following the unexpected leap in interest rates on the overnight
loans between banks in early August 2007 and the subsequent turmoil
in world money markets - a so-called "black swan" event,
something that market participants had not seen before and therefore
assumed could not exist - the Federal Reserve took several steps to
stabilize the situation. In A Black Swan in the Money Market (NBER
Working Paper No. 13943),
John Taylor and John Williams demonstrate that increased
counterparty risk between banks contributed to the rise in money
market interest rate spreads. They find no
evidence that the Fed's liquidity measures reduced these
spreads.
The Fed made several attempts to improve
conditions in money markets and thereby reduce the spread between
term inter-bank lending rates, such as the three-month Libor (London
Inter-Bank Offer Rates), and the overnight rate. An initial step,
lowering the penalty on borrowing at the discount window, and thus
bringing the discount rate below the prevailing Libor, failed to
encourage banks to borrow from the discount window. Four months after
the crisis had begun, the Fed introduced the Term Auction Facility
(TAF), which allowed banks to borrow from the Fed without using the
discount window.
Because the spread narrowed between December
2007 and the end of February 2008, it appeared that the TAF was
working. Soon, however, the spread began widening again, and the
renewed stress in the markets necessitated a host of new Fed actions
and lending facilities. Since the financial turmoil continues to this
day, Taylor and Williams analyze the initial phase of the crisis,
specifically the 161 trading days between August 9, 2007 and March
30, 2008. They focus on three key money market interest rates: the
target for the federal funds interest rate as set by the federal Open
Market Committee, the daily effective overnight federal funds rate in
the market, and the interest rate on the three-month Libor.
The
"black swan" is perhaps most notable by the fact that from
January through August 8, 2007, the standard deviation of difference
between effective funds rate and the target was only 3 basis points,
but from August 9, 2007 to March 30, 2008 the standard deviation was
20 basis points. Taylor and Williams suggest that the spreads between
the three-month Libor and the Fed's overnight federal funds rate
target increased dramatically starting in
August and fluctuated erratically thereafter. During the year
prior to August 9, 2007, the three-month Libor spread above the
target federal funds averaged only 11 basis points with a standard
deviation of merely a single basis point. Similar non-volatile
changes in spreads between term rates and overnight rates were
apparent for other Libor maturities and for several other
countries.
Among the many explanations put forward for the
marked increase in the Libor spread are "counterparty
risk" (bearing in mind that inter-bank lending in the
Libor market or term, Fed funds is unsecured); "liquidity
risk," in which traders at one bank are reluctant to
expose their institution's funds during a period in which those funds
might be needed to cover the bank's own shortfalls; the notion that
banks needed liquidity for purposes of their balance sheets in
end-of-year financial reports; and expectations of future interest
rate changes, especially declining rates.
To test these risk,
liquidity, and expectation theories, Taylor and Williams developed a
model that examined the Libor rate, the Overnight Index Swap (OIS)
rate, and the accepted bid on the Term Action Facility (TAF).
Comparing the behavior of these three activities and plotting their
spreads allowed the researchers to separate out patterns of risk,
liquidity, and expectations. For comparison and for supporting
evidence, they also applied the same adjustment method to calculate
the Libor spreads in the Euro, sterling, yen, and other
currencies.
The researchers applied simple regressions to
daily data to test how risk measures and liquidity measures like the
Federal Reserve's Term Auction Facility affected the Libor-OIS
spread. Five sets of regressions corresponding to different risk
measures all emerge with highly significant results in both one-month
and three-month maturity regressions. But, in stark contrast, the
authors find no relationship between the TAF
and the interest rate spread.
Nor should this be
especially unexpected, say Taylor and Williams. They remind us that
in assessing the effects of the TAF, it is important to note that it
does not increase the amount of total liquidity in the money markets.
Any increase in liquidity that comes from banks borrowing from the
Fed using the TAF will be offset by open market sales of securities
by the Fed to keep the total supply of reserves from plummeting. The
actions are essentially automatic in the sense that the Fed must sell
securities to keep the federal funds rate on target. For these
reasons, Taylor and Williams conclude that counterparty risk is a key
factor in explaining the spread between the Libor rate and the OIS
rate, and the TAF should not have an effect on the spread.
--
Matt Nesvisky
http://papers.nber.org/papers/W13943
Copyright
mediaforfreedom.com